
Figure 1.
The intermolecular coordinate frame used in this paper.
Figure 2.
Comparison of the O-O, O-H, and H-H correlation functions for the
TIP4P and ST2 water models at ambient conditions [thin solid line
(epsilonrinfinity=80) and dotted line
(epsilonrinfinity=1) which coincide within the scale of the
graph] with those for the truncated models (8/10) (dashed line) and
(4/6) (thick solid line). The curves are subsequently shifted by 1.

Figure 3.
Relative deviations, equation (18), in the O-O correlation
functions. The reference result is the thin horizontal
line, for other symbols see the caption to figure 2.
Positions of the first maxima on the reference correlation functions
[for the full (epsilonrinfinity=80) and short-range (4/6)
models only] are marked by thin vertical lines.
The curves for different temperatures are subsequently shifted by
appropriate values.
Figure 4.
The same as figure 3 for the O-H correlation functions with the first
maxima of gOH marked by thin vertical lines.

Figure 5.
The same as figure 3 for the H-H correlation functions.
Figure 6.
Comparison of the dipole-dipole correlation functions PI1(r).
For the description of lines see the caption to figure 2.
The curves are subsequently shifted by 0.5.

Figure 7.
Comparison of the running Kirkwood factors, equation (15), at
ambient conditions.
For the description of lines see the caption to figure 2.
The horizontal straight lines represent the limiting Kirkwood factor
g1, equation (13).
Figure 8.
The same as figure 6 for PI2(r).
The curves are subsequently shifted by 0.25.
Figure 9.
Contour plots showing the 2D correlation functions
g2D(rOO,rOH) (left) and
g2D(rOH,rOH) (right) for the TIP4P water
(epsrinfinity=80, green) and the short-range
TIP4P(4/6) model (magenta) at ambient conditions;
overlapping contours appear black. The inset shows the cross section
at rOO marked by the thin line. Numbers at lines denote values
of g2D.

Figure 10.
The correlation function g(1,2) at
selected rOO separations indicated by numbers in the corner
(at first two maxima and two minima and at the middle points between
two adjacent extremes) for the TIP4P water model
(epsrinfinity=80) at ambient conditions.
The pictures with ligth blue background show a compositions made up of
1000 maximum values of the correlation fuction, the yellow background
picture of only 100.

Figure 11.
The same as figure 10 for the short-range TIP4P(4/6) model.
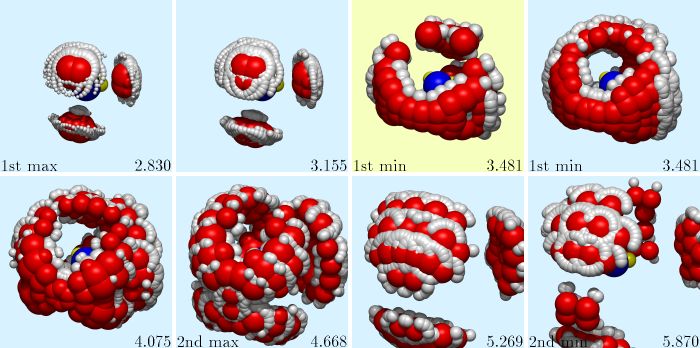
Figure 12.
The same as figure 10 for the ST2 (epsilonrinfinity=80) model.
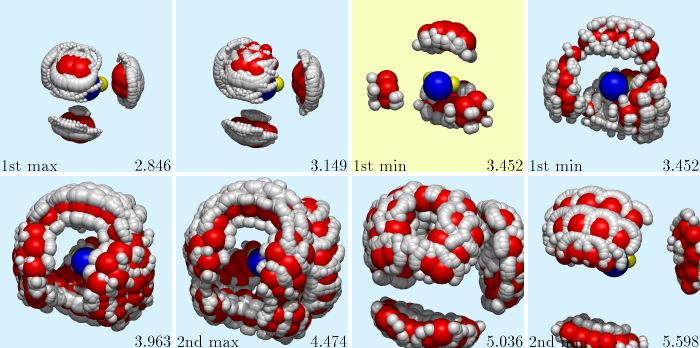
Figure 13.
The same as figure 10 for the short-range ST2(4/6) model.

Figure 14.
The most probable configurations of a pair of water molecules at the
first minimum of g(1,2) at ambient conditions.